Product Design
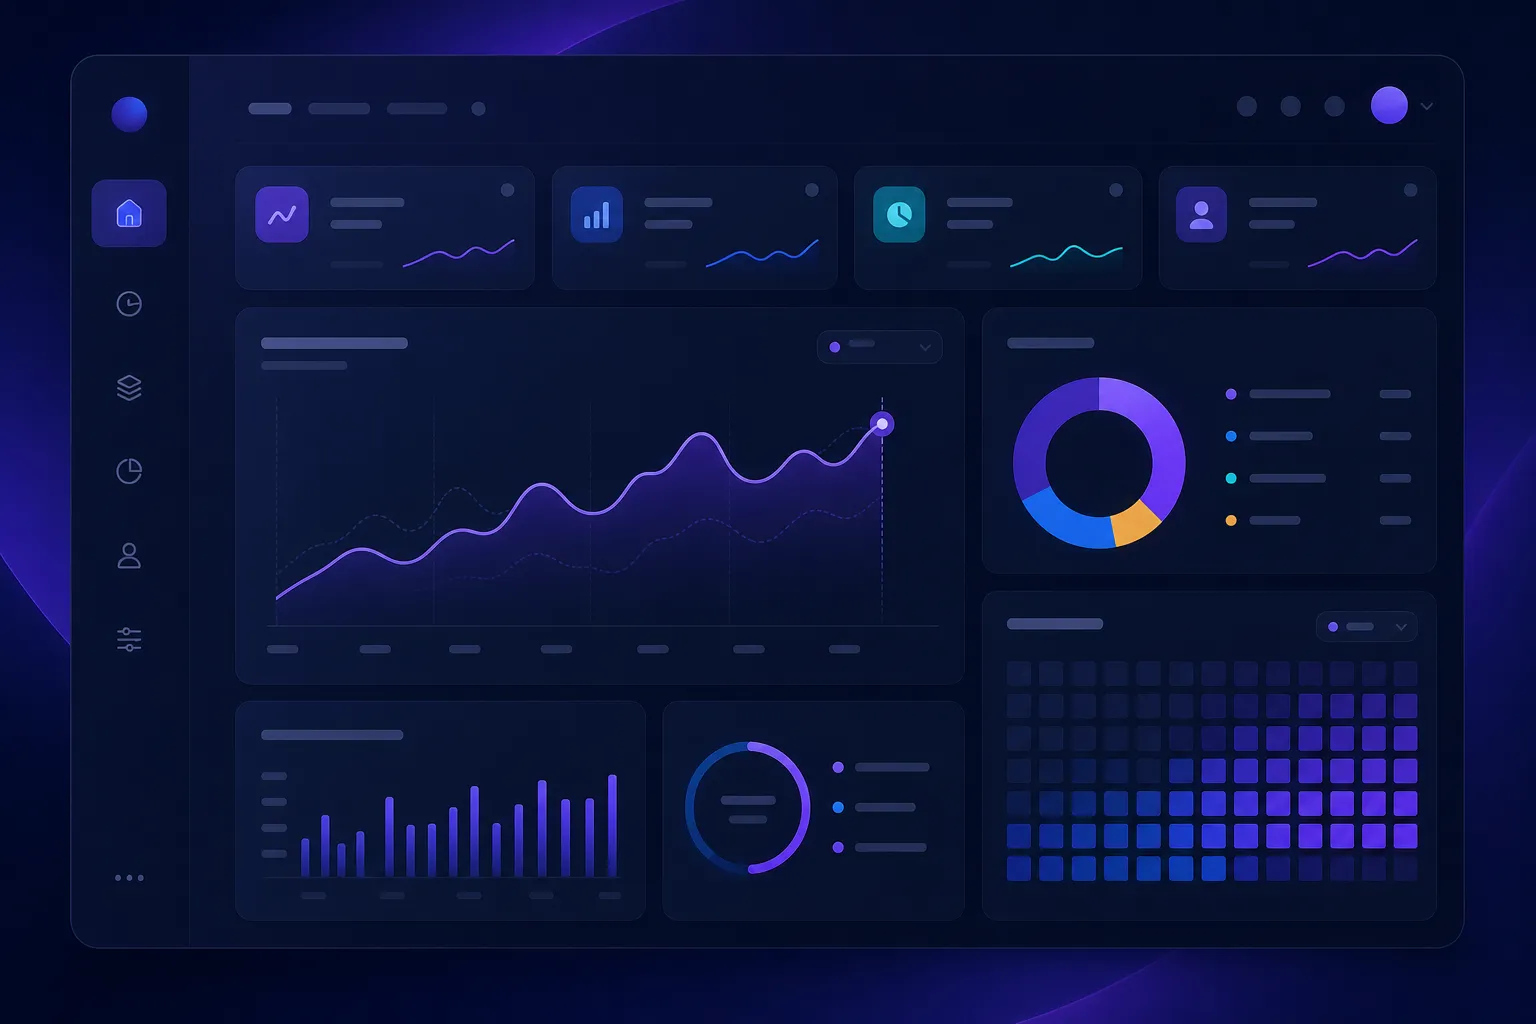
Flowstack Analytics Dashboard
Redesigned a complex B2B analytics dashboard to improve onboarding completion and reduce time-to-insight for non-technical users.
- Client
- Flowstack
- Year
- 2025
- Role
- Lead Product Designer
- Technologies
- Figma React TypeScript Tailwind CSS
Overview
Flowstack needed a dashboard that felt approachable for marketing teams while still supporting power users in data-heavy workflows. The existing interface buried key metrics behind nested menus and inconsistent chart patterns.
Problem
- New users abandoned setup during the third onboarding step
- Support tickets frequently referenced “where do I find X?”
- Visual hierarchy competed across three product areas merged into one shell
Solution
I mapped core jobs-to-be-done with the founding team, simplified navigation into task-based sections, and introduced a progressive disclosure pattern for advanced filters. A modular chart system ensured consistency while allowing flexible dashboards per role.
Result
- Onboarding completion increased by 34% within six weeks of launch
- Average time-to-first-insight dropped from 12 minutes to under 4
- Support volume for navigation-related questions fell by 41%
Key deliverables
- Information architecture and user flows
- High-fidelity UI in Figma with responsive breakpoints
- Component documentation for engineering handoff
- Usability testing plan and iteration report
Interested in similar work?
Let's discuss your product, timeline, and how we can create something equally polished.